Website Statistics
You can view your website statistics by going to Website -> Statistics section.
Please note this is an experimental feature which we're still fine-tuning while we gather data and perfect our methods.
Choose Which Time Frame To Analyse
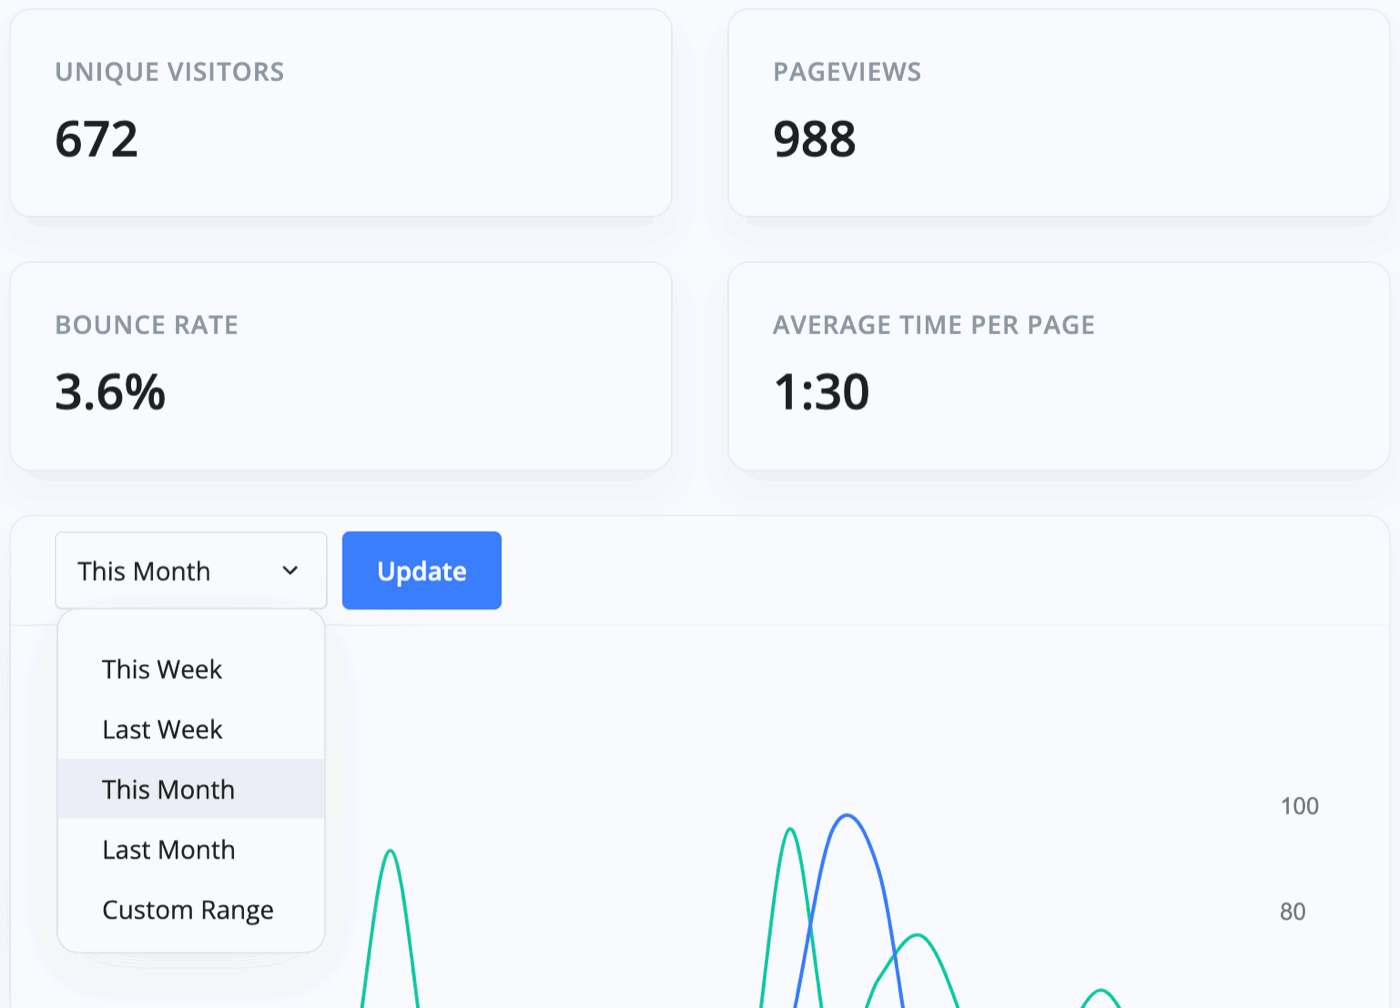
You'll see in the top left of the first graph that you have a drop-down menu to choose which period you'd like to show the stats for. There are predetermined time frames such as 'This Week' or 'Last Month' or you can create your own custom date range.
General Statistics
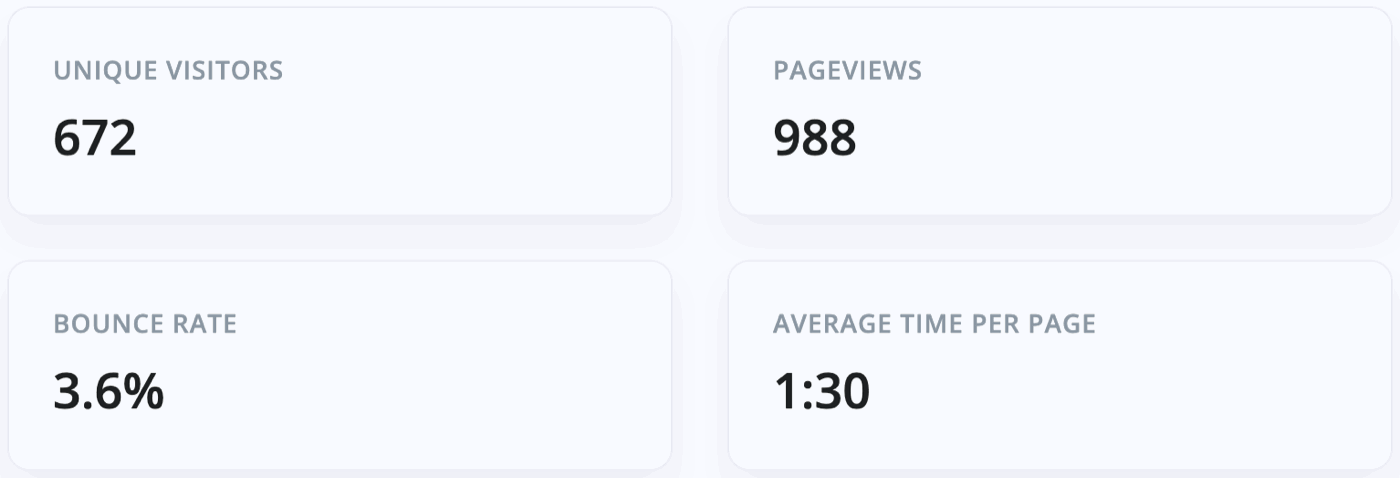
The first group of statistics are for website traffic. You can see the unique visitors, page views, the percentage of people who click away from your website before engaging, and finally the average time spent on your web pages. These are shown in summary boxes at the top but are also displayed on a graph and table just below this.
Detailed Statistics
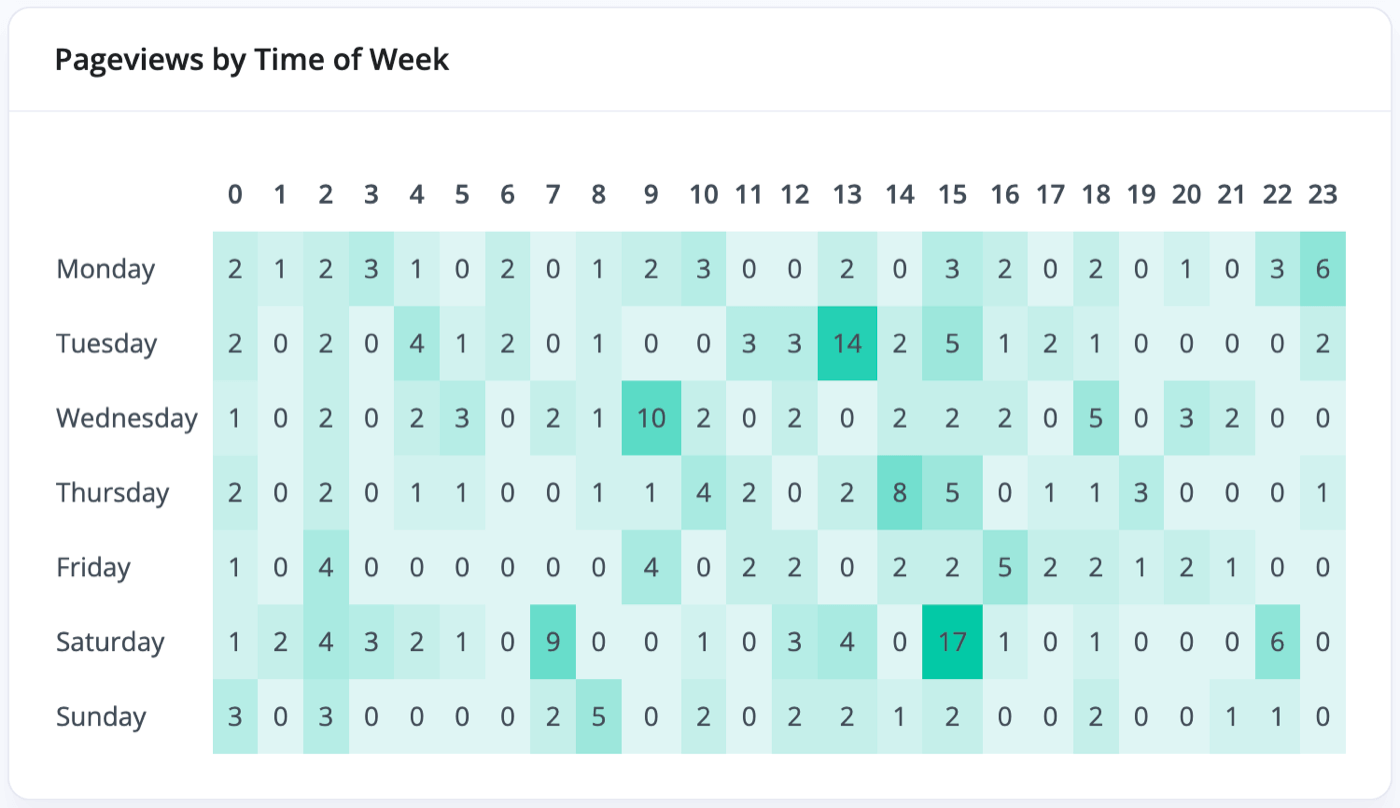
'Pageviews by Time of Week' gives you insight into which days and times most of your engagement occurs.
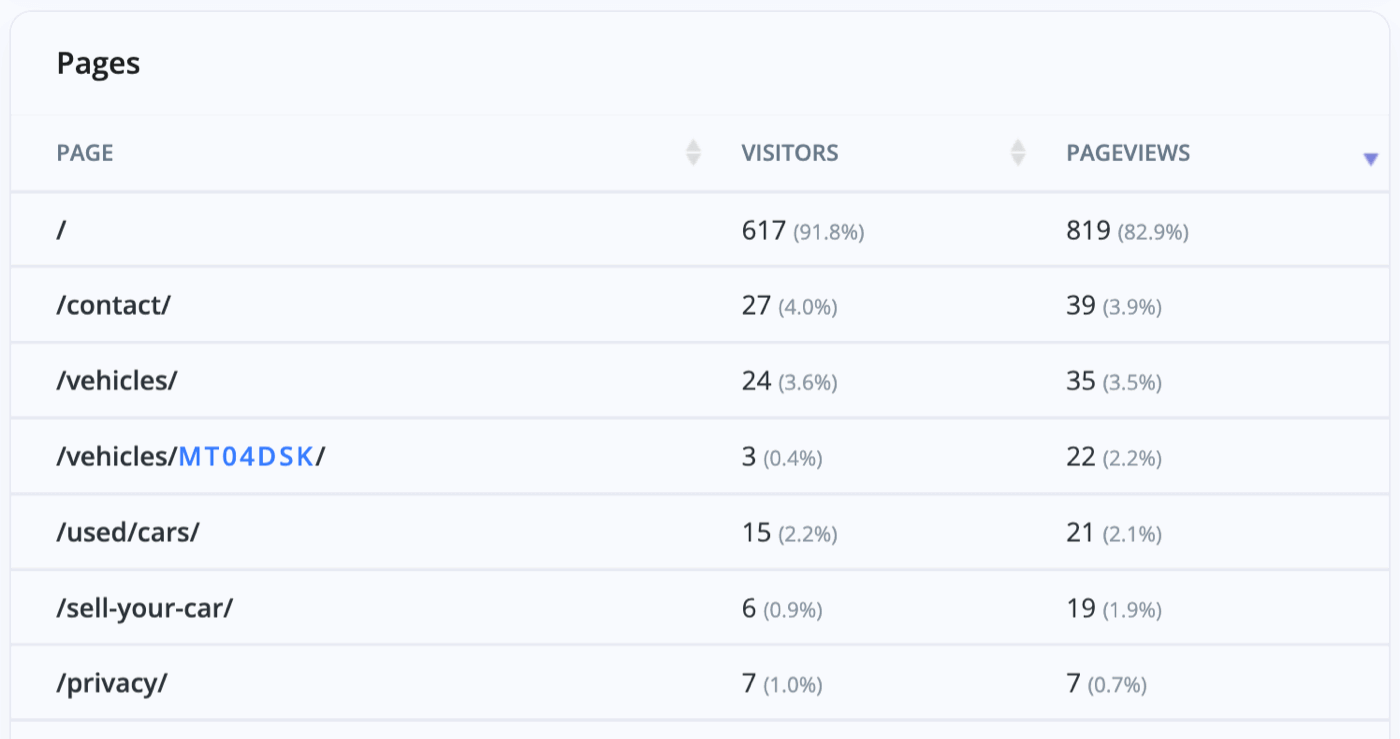
'Pages' lets you see a breakdown of which exact web pages your website visitors are visiting.
On the right-hand side of this you can see 'Referrers' which will tell you if any traffic is reaching your website from external domains, i.e clicking a link on a review site.
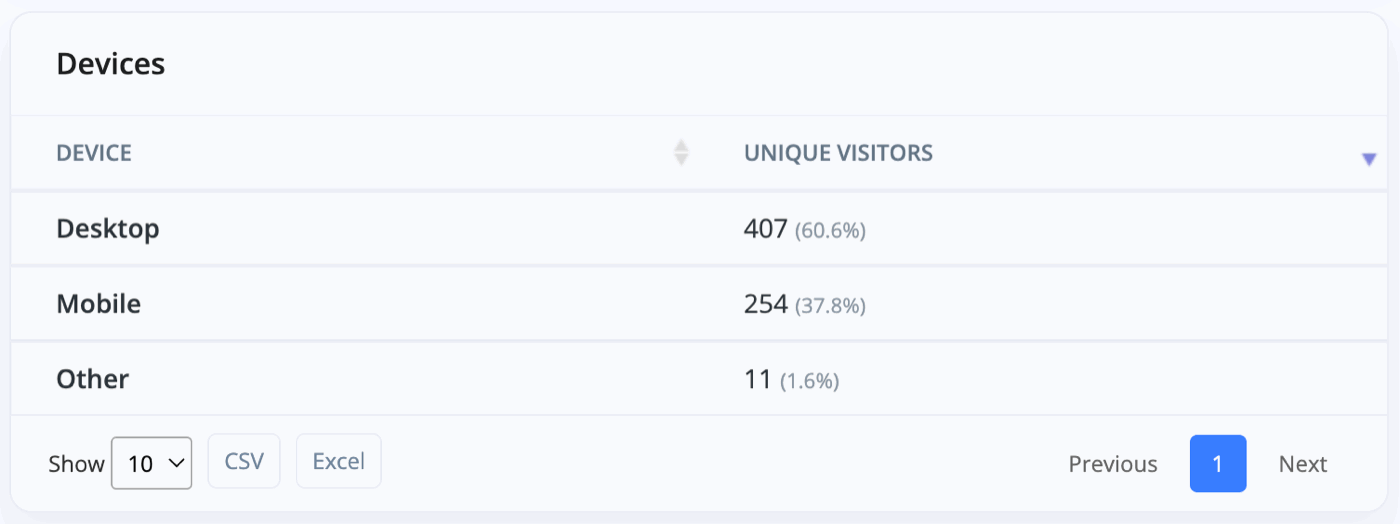
'Devices' will show you whether your website's visitors are using a computer, phone or another device when they access your site.
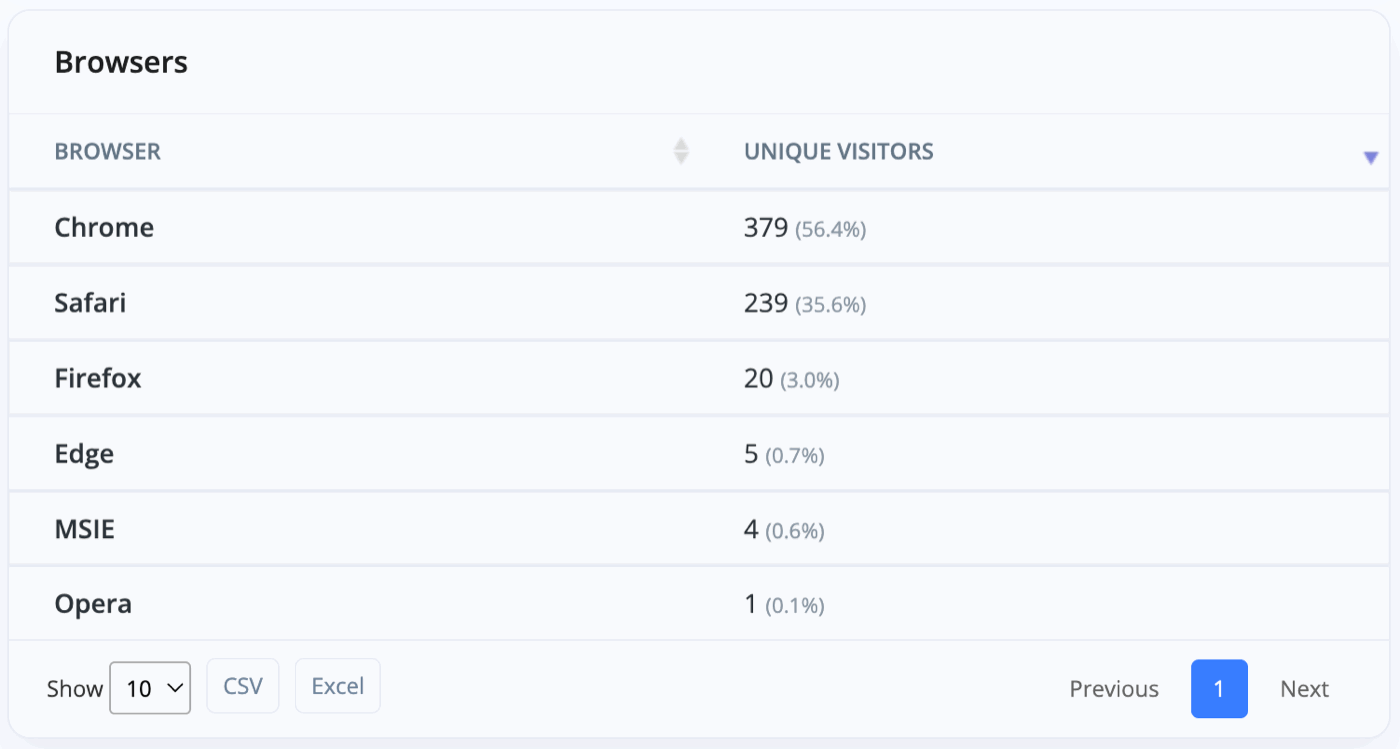
'Browsers' shows you which web browsers your visitors tend to favour.
UTM Analytics
UTM (Urchin Tracking Module) statistics show you where traffic has come through to you. For example, from a Google Advertising Campaign. These will be broken down into 'Source', 'Medium', 'Campaign' and 'Content'.An example may look like:
- Source: Google, Facebook, Instagram
- Medium: Organic, Email, CPC
- Campaign: 'Summer Sale'
- Content: Typically used for paid traffic only and represents the ad's content
Usage Guide
- Account Alerts & Sales Channel Error Notifications
- Adding & Managing Contacts (Customers & Suppliers)
- Adding A Vehicle
- Adding Appointments To Your Calendar
- Adding Pre-Defined Products & Services
- Adding Website Pages & Navigation Links
- Adding Website Tags
- Aftersales Invoices
- AI Lead Assistant
- AI SEO Search Results Explained
- Batch Invoice
- Booking Types & Website Booking Forms
- Branding Your Website
- Browse Vehicles
- Business Contact Details (Telephone & Social Media)
- Business Details (Address, Legal Name & Company Number)
- Business Follow-Ups - Automated SMS & Emails To Customers
- Business Opening Hours (and Holiday Closures)
- Business Social Networks
- Business Users & Roles
- Cancelling A Vehicle Sale or Reservation
- Changing Vehicle Registration (Number Plate)
- Changing Your Membership Plan
- Connecting Finance (iVendi, Codeweavers, CarFinance247 & Evolution Funding)
- Connecting Third-Party Services
- Creating Invoices, Purchase Invoices & Orders
- Customer & Courtesy Vehicles
- Deal Builder
- Display A Different Business Address In MotorDesk
- Displaying Announcements With Website Banners
- Editing Auto-Generated Content In MotorDesk
- Editing Website Pages
- Exporting Business Data
- Filtering Junk Leads
- Handover Process
- Historic Data Viewer
- How MotorDesk Integrates with Sage, Xero & QuickBooks
- How to Add an AA Dealer Promise/Warranty Page
- How To Change Your Website Images
- How To Enable Online Reservations
- Importing Business Data
- Importing Your AutoTrader Stock
- Initial Website Set-Up & Picking A Website Template
- Invoice Customisation
- Membership Payments
- Membership Plans, Data Charges & Payments
- Navigating MotorDesk & Your Dashboard
- OCR (Automatic Invoice Reader) Help
- Remove A Vehicle
- Sales Leads & Chat
- Sales Reports
- Selling A Vehicle
- Selling Multiple Vehicles At Once
- Sending & Signing Documents
- Show Sold Vehicles On Website
- Taking Deposits & Part Payments In MotorDesk
- Un-Publish A Vehicle
- Updating Your Contact Details
- User Profile (Change Email & Password)
- Vehicle Analyser
- Vehicle Appointments
- Vehicle Check
- Vehicle Checklists
- Vehicle Competitors
- Vehicle Condition Reports
- Vehicle Details
- Vehicle Documents
- Vehicle Finance Invoices
- Vehicle History
- Vehicle Images & Videos
- Vehicle Import
- Vehicle Job Boards
- Vehicle Leads & Orders (Leads & Deals)
- Vehicle Locations
- Vehicle Optional Extras, Features & Descriptions
- Vehicle Overview
- Vehicle Photo Background Removal
- Vehicle Purchase & Costs
- Vehicle Quick Check
- Vehicle Reservations
- Vehicle Settings
- Vehicle Silent Saleman
- Vehicle Specification
- Vehicle Stock & Price
- Vehicle Test Drives
- Vehicle Workflows
- Vehicles For Sale Limit Reached
- Vehicles Settings
- Vehicles Stock Book
- Website AI SEO
- Website Banner Settings
- Website Blog Articles
- Website Customer Reviews
- Website Deal Builder Settings
- Website Header & Footer
- Website Live Chat Settings
- Website Settings
- Website Statistics
- Website Valuation Settings
- Website Vehicle Search Result Design